


This is a solution to the Expenses chart component challenge on Frontend Mentor.
Requirements
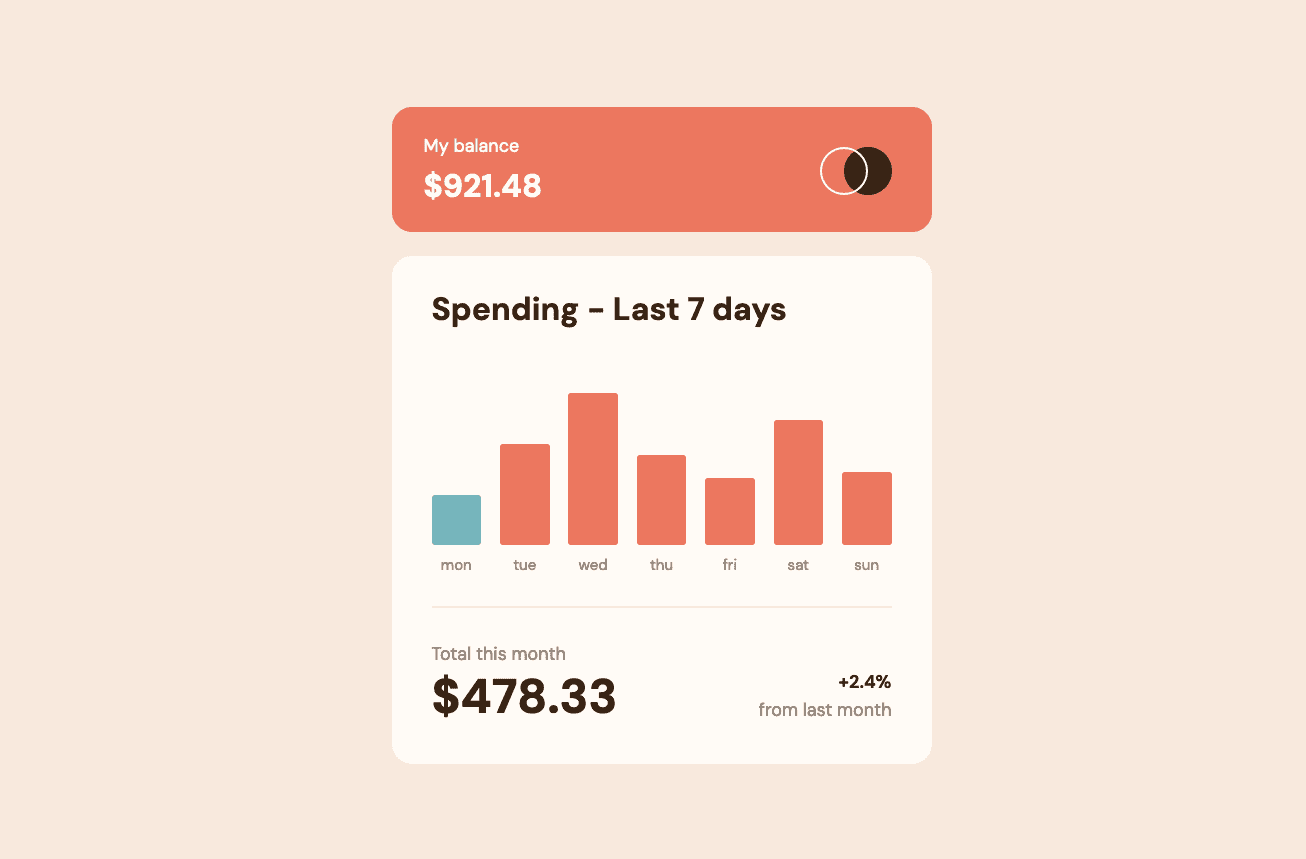
Users should be able to:
- View the bar chart and hover over the individual bars to see the correct amounts for each day
- See the current day’s bar highlighted in a different colour to the other bars
- View the optimal layout for the content depending on their device’s screen size
- See hover states for all interactive elements on the page
- Bonus: Use the JSON data file provided to dynamically size the bars on the chart
Built with
Code Quality with
Implementation time
This challenge was completed over a span of 2 hours.